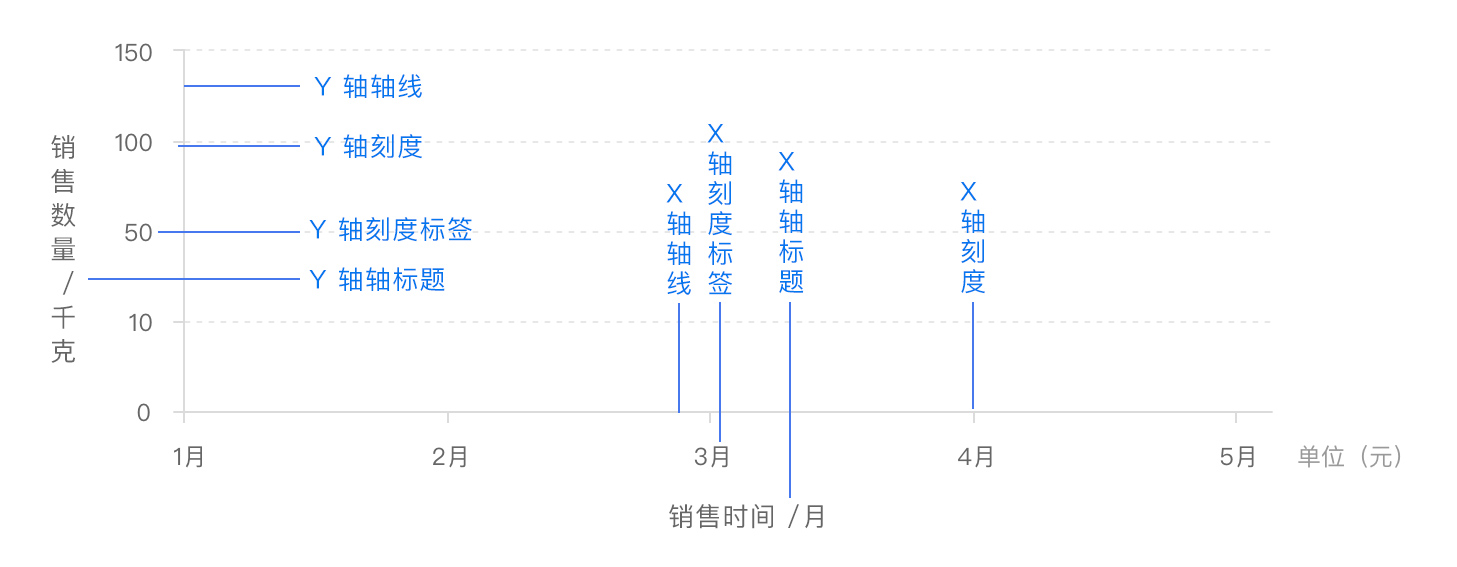
x 轴、y 轴
x 轴和 y 轴都由轴线、刻度、刻度标签、轴标题四个部分组成。部分图表中还会有网格线来帮助查看和计算数据。

普通的二维数据坐标系都有 x 轴和 y 轴,通常情况下,x 轴显示在图表的底部,y 轴显示在左侧,一般配置如下:
option = {
  xAxis: {
    // ...
  },
  yAxis: {
    // ...
  }
};
x 轴常用来标示数据的维度,维度一般用来指数据的类别,是观察数据的角度,例如“销售时间” “销售地点” “产品名称”等。y 轴常常用来标示数据的数值,数值是用来具体考察某一类数据的数量值,也是我们需要分析的指标,例如“销售数量”和“销售金额”等。
option = {
  xAxis: {
    type: 'time',
    name: '销售时间'
    // ...
  },
  yAxis: {
    type: 'value',
    name: '销售数量'
    // ...
  }
  // ...
};
当 x 轴(水平坐标轴)跨度很大,可以采用区域缩放方式灵活显示数据内容。
option = {
  xAxis: {
    type: 'time',
    name: '销售时间'
    // ...
  },
  yAxis: {
    type: 'value',
    name: '销售数量'
    // ...
  },
  dataZoom: [
    // ...
  ]
  // ...
};
在二维数据中,轴也可以有多个。ECharts 中一般情况下单个 grid 组件最多只能放两个 x/y 轴,多于两个 x/y 轴需要通过配置 offset 属性防止同个位置多个轴的重叠。两个 x 轴显示在上下,两个 y 轴显示在左右两侧。
option = {
  xAxis: {
    type: 'time',
    name: '销售时间'
    // ...
  },
  yAxis: [
    {
      type: 'value',
      name: '销售数量'
      // ...
    },
    {
      type: 'value',
      name: '销售金额'
      // ...
    }
  ]
  // ...
};
轴线
ECharts 提供了轴线 axisLine 相关的配置,我们可以根据实际情况调整,例如轴线两端的箭头,轴线的样式等。
option = {
  xAxis: {
    axisLine: {
      symbol: 'arrow',
      lineStyle: {
        type: 'dashed'
        // ...
      }
    }
    // ...
  },
  yAxis: {
    axisLine: {
      symbol: 'arrow',
      lineStyle: {
        type: 'dashed'
        // ...
      }
    }
  }
  // ...
};
刻度
ECharts 提供了轴线 axisTick 相关的配置,我们可以根据实际情况调整,例如刻度线的长度,样式等。
option = {
  xAxis: {
    axisTick: {
      length: 6,
      lineStyle: {
        type: 'dashed'
        // ...
      }
    }
    // ...
  },
  yAxis: {
    axisTick: {
      length: 6,
      lineStyle: {
        type: 'dashed'
        // ...
      }
    }
  }
  // ...
};
刻度标签
ECharts 提供了轴线 axisLabel 相关的配置,我们可以根据实际情况调整,例如文字对齐方式,自定义刻度标签内容等。
option = {
  xAxis: {
    axisLabel: {
      formatter: '{value} kg',
      align: 'center'
      // ...
    }
    // ...
  },
  yAxis: {
    axisLabel: {
      formatter: '{value} 元',
      align: 'center'
      // ...
    }
  }
  // ...
};
示例
图左侧的 y 轴代表东京月平均气温,右侧的 y 轴表示东京降水量,x 轴表示时间。两组 y 轴在一起,反映了平均气温和降水量间的趋势关系。
option = {
tooltip: {
trigger: 'axis',
axisPointer: { type: 'cross' }
},
legend: {},
xAxis: [
{
type: 'category',
axisTick: {
alignWithLabel: true
},
data: [
'1月',
'2月',
'3月',
'4月',
'5月',
'6月',
'7月',
'8月',
'9月',
'10月',
'11月',
'12月'
]
}
],
yAxis: [
{
type: 'value',
name: '降水量',
min: 0,
max: 250,
position: 'right',
axisLabel: {
formatter: '{value} ml'
}
},
{
type: 'value',
name: '温度',
min: 0,
max: 25,
position: 'left',
axisLabel: {
formatter: '{value} °C'
}
}
],
series: [
{
name: '降水量',
type: 'bar',
yAxisIndex: 0,
data: [6, 32, 70, 86, 68.7, 100.7, 125.6, 112.2, 78.7, 48.8, 36.0, 19.3]
},
{
name: '温度',
type: 'line',
smooth: true,
yAxisIndex: 1,
data: [
6.0,
10.2,
10.3,
11.5,
10.3,
13.2,
14.3,
16.4,
18.0,
16.5,
12.0,
5.2
]
}
]
};
这里简要介绍了坐标轴相关的常用配置项及用法,更多关于坐标轴配置项及用法请移步官网。


